Moderator analysis
Refer to the Moderator Analysis sheet in the User Manual for details on how to run the analysis.
The workbooks and a pdf version of this guide can be downloaded from here.
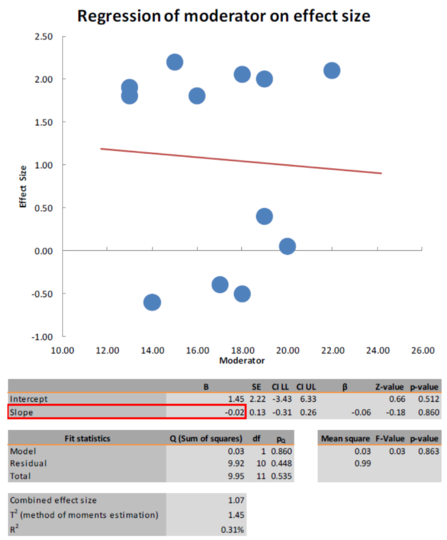
Output on the Moderator Analysis sheet consists of a scatter plot with a regression line and a table with a number of statistics (see Figure 7).

Figure 7: Example of the Moderator Analysis sheet
Although Meta-Essentials generates the statistics that are usually presented in a regression analysis, it is not wise to give much weight to these outcomes, particularly because there is only a small number of data points (studies). As with any regression analysis, the researcher should begin with an interpretation of the scatter plot, not of the line drawn through it. In the example in Figure 7, for instance, it is clear from the scatter plot that there is no observable relation between the moderator and the observed effect sizes. In this example, this is confirmed by the “insignificant” result of a significance test for the regression weight.
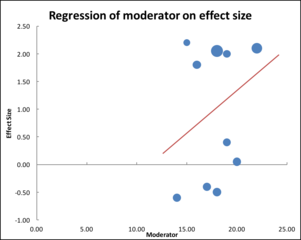
Let us assume that the moderator in this example is the average size of a class in the schools or school districts that were studied. The result of this moderator analysis, then, suggests that the class size does not have an influence on the effect of the intervention. However, these results are very sensitive for the addition of removal of a single study, and the “sample size” is so small that even a very steep regression line (or high weight) will not be significant. In Figure 8, for instance, only two studies have been removed. Visual inspection of the scatter plot after removal of two studies (Figure 8) still suggests that there is hardly any relation between the value of the moderator and the observed effect size. The regression line, however, is steep.

Figure 8: Example of the Moderator Analysis sheet
We know that this is “caused” by the removal of two studies in the top left corner of the plot. However, how sure can one be that the absence of studies in the bottom right corner is not caused by selection bias in the studies that have been conducted? The p-value of the regression analysis (not presented in Figure 8) indicates that the regression weight is statistically “not significant”. This, however, is to be expected with the (inevitable) low statistical power of this analysis. Lack of significance certainly does not mean absence of a moderating effect! For this reason, information about the statistical significance of this regression result should not be used.
More importantly, because it is the aim of the moderator analysis to explore a potential explanation for dispersion of observed effect sizes, it should be used only in a set of studies in which such dispersion exists. In the preceding subgroup analysis it was observed that subgroup AA (e.g., the United Kingdom) is rather homogeneous. There is no dispersion of effect sizes to be explained in this subgroup (i.e., the group of studies above the regression line in Figures 7 and 8). Therefore, it is not wise to include this subgroup in the moderator analysis. In this example moderator analysis should be performed for subgroup BB (other countries than the United Kingdom) only. Figure 9 presents the results of that analysis.

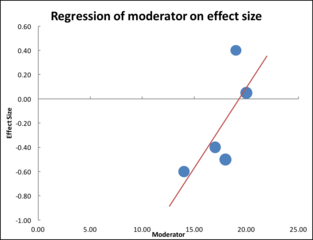
Figure 9: Example of the moderator analysis in subgroup BB only
The steep regression slope in Figure 9 suggests that higher effects might be observed in other countries in situations in which average class size is higher than in the situations that have been studied. But we cannot be sure whether that is true because no studies have been done in such situations with higher average class size, perhaps because such large average class size (over 25) happens to be non-existent. If this is indeed the case, the conclusion can be drawn that such a potential effect is not relevant for current policy contexts.
The regression weight in subgroup BB (Figure 9) is statistically highly significant (p=0.004) despite the very low statistical power. But, again, the researcher knows this already from the scatter plot. It is clear that the addition of just one study in the top left corner of the scatter plot or, for that matter, in its bottom right corner, could change the results of this analysis considerably. Therefore, the general recommendation for both the subgroup analysis and the moderator analysis is to use its results only for exploration, i.e., for the development of ideas, and not for “testing”.
The worry underlying the recommended caution in interpreting the results of a meta-analysis in general, and of the subgroup and moderator analysis in particular, is that the set of studies that are meta-analysed is always an arbitrary selection from all studies that could have been performed about the effect. The selection of this arbitrary set is likely to be biased, but the type and size of this bias is unknown.


