Egger regression and Begg and Mazumdar correlation test
The workbooks and a pdf-version of this user manual can be downloaded from here.
The Egger regression gives “the degree of funnel plot asymmetry as measured by the intercept from regression of standard normal deviates against precision” (Egger, Smith, Schneider, & Minder, 1997, p. 629). The output on this sheet consists of this intercept (and its confidence interval) as well as of the outcome of a t-test (t-value and p-value) (see Figure 21 for an example).
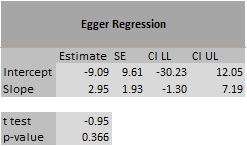
Figure 21: Example of Egger regression part of the Publication Bias Analysis sheet
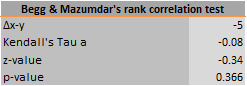
The Begg and Mazumdar rank correlation test uses the correlation between the ranks of effect sizes and the ranks of their variances (Begg & Mazumdar, 1994, p. 1088). This sheet presents (a) the difference between concordant and discordant ranks (∆x-y), (b) the rank correlation (Kendall’s Tau a), (c) a z-value as well as (d) a p-value for this correlation (see Figure 22 for an example).
References
Begg, C. B., & Mazumdar, M. (1994). Operating characteristics of a rank correlation test for publication bias. Biometrics, 50(4), 1088-1101. dx.doi.org/10.2307/2533446
Egger, M., Smith, G. D., Schneider, M., & Minder, C. (1997). Bias in meta-analysis detected by a simple, graphical test. British Medical Journal, 315(7109), 629-634. dx.doi.org/10.1136/bmj.315.7109.629