Galbraith Plot
The workbooks and a pdf-version of this user manual can be downloaded from here.
The basic idea of the Galbraith plot or radial plot (Galbraith, 1988) is to run an unweighted regression of z-scores on the inverse of the standard error with the intercept constrained to zero (see Figure 24). This plot can be used to look for outliers in the effect sizes. The expectation is that 95% of the studies is within the area defined by the two (lighter coloured) confidence interval lines. Meta-Essentials gives a table with studies, a plot and a table with regression estimates (see Figure 24).
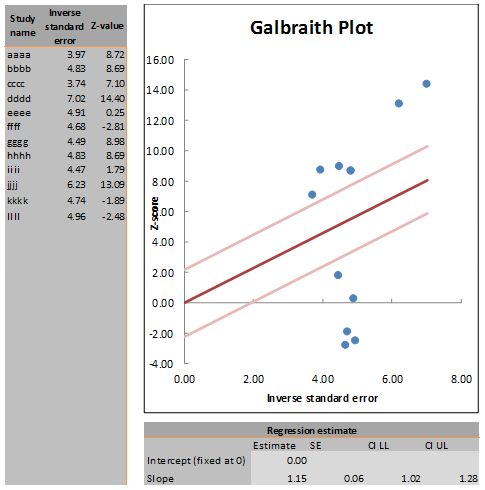
Figure 24: Example of Galbraith Plot part of the Publication Bias Analysis sheet
References
Galbraith, R. F. (1988). Graphical display of estimates having differing standard errors. Technometrics, 30(3), 271-281. dx.doi.org/10.1080/00401706.1988.10488400