Short explanation on storage strategy
Storage strategy
The storage strategy is a strategy by which you determine where to store your products.
If using a random storage strategy, products are stored at an arbitrary empty location, while the ABC storage strategy uses categories (A, B and C) in which the products are grouped on the basis of their turnover rates. These categories each have their own section in the warehouse. The A-category is situated near to the depot and exists of products, representing only a small part of the assortment, but a large part of the picks. Whereas the C-category exists of products, representing a large part of the assortment, but only a small part of the picks. In this way the most wanted (and thus most picked) items are situated as near as possible to the depot which leads to the shortest picking route. If you use an ABC storage strategy, you have to choose between one of the two options for the layout of the ABC-classification, which can look like this:
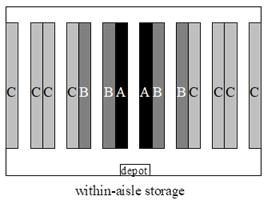
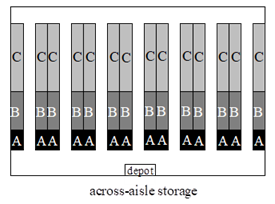
ABC-1 will automatically be mirrored if the depot is at the right end of the warehouse, or symetrically grouped around the center if the depot is in the middle.
Size of the zones
For each of the chosen ABC layout types, the relative size of the different storage zones has to be indicated as a percentage of the size of the whole warehouse. Only the percentages of category A and B have to be filled in, because C is the result of 100 minus A minus B. In layout ABC-1 it is automatically assumed that there is at least 1 full A-aisle or 1 full B-aisle if their category percentage is greater than 0.When choosing the size of the zones, the minimum for the A and B zone is 1 %. If the percentage not results in a whole aisle, than a rounding has to be completed: when a warehouse consists of 10 aisles en the A-zone is 14 %, than the number of A-aisles will be 2 in 40 % of the simulationruns and 1 in the other 60 % of the runs.
Percentage of picks
The percentage of picks per turnover category (A, B or C) is the percentage of the number of picks per category compared with the total number of picks. When category A accounts for 1100 picks a day, while the total number of picks (those from category A, B and C) is 1650, then the percentage of picks will be 66,7 %. The percentages for A, B and C will sum to 100 %. Only the percentages of category A and B have to be filled in, because C is the result of 100 minus A minus B.
Average number of lines per order
The average number of lines per order is the number of lines per day divided by the total number of orders per day.
Administration time
The administration time per order consists of collecting or depositing a pick device, obtaining or confirming a pick list, etc.
When the administration time per order is known and the time to pick an order, then the total time to collect all items per order can be calculated. This also enables it to make a realistic calculation of total savings per day.
Time to pick a line
The time to pick a line is the average time, needed to pick one line. This is the time it takes to retrieve the items from a pick location to the pick device, which is already located in front of the pick location. In practice, this time will be equal to the time an orderpicking truck is located in front of the pick location from the moment the truck stops until the route is continued.