The Forest plot
Refer to the Forest Plot sheet in the User Manual for details on how to run the analysis.
The workbooks and a pdf version of this guide can be downloaded from here.
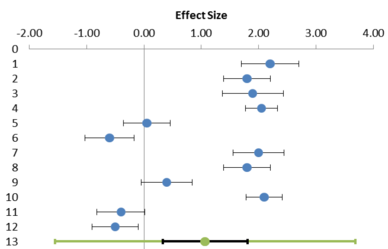
The main outcome of any meta-analysis is a forest plot, a graphical display as in Figure 1, which is an example of a forest plot generated with Workbook 1 (Effect size data.xls) of Meta-Essentials. This is the same plot as is used as an example in the User Manual. The x-axis forms the effect size scale, plotted on the top of the plot. Each row, except the bottom one, represents a study’s effect size estimate in the form of a point and a (95%) confidence interval. This is the statistically correct way of representing the results of a single study, namely as an estimate of an interval in which the “true” effect (in the population) will most probably lie. Remember that it is assumed that every study in the meta-analysis is a study of a complete probability sample of a specified population. If this assumption is not met in a study, no inference can be made from the “sample” to a population and hence, comparing the observed effect size with observations in other studies is not meaningful.

Figure 1: Example of a forest plot in Meta-Essentials
The point estimate is represented in the forest plot by a smaller or a larger bullet. The relative size of these bullets represents a study’s weight in the generation of the meta-analytic result.
The plot presented in Figure 1 is fictitious and constructed for illustration purposes. Its characteristics are typical for forest plots in the social sciences:
- Some confidence intervals are entirely on the positive side of zero. In traditional terminology, these studies show a statistically significant positive effect.
- Other confidence intervals are entirely on the negative side of zero. In traditional terminology, these studies show a statistically significant negative effect.
- Other confidence intervals include zero. In traditional terminology, these studies show an effect that is not statistically significant.
The forest plot, discussed so far, is just a pictorial representation of results of a set of studies. The same information (point estimates with confidence intervals, and weights, for every study) could also have been expressed by numbers in a table. This table is actually also available on the forest plot sheet in Meta-Essentials, on the left side of the plot (see Figure 2).

Figure 2: Part of forest plot sheet in Meta-Essentials, with a table and its corresponding pictorial representation
The bottom row (or “summary row”) of the forest plot turns the plot into a “meta-analysis”. This is the row that represents the result of the meta-analysis. In Meta-Essentials this meta-analytic result (line 13 in Figure 1) consists of two intervals, both around the same bullet. This bullet represents the weighted average effect, to which we will refer as “combined” effect size. The smaller, black, interval is a confidence interval. The larger, green, interval is the prediction interval. We will discuss the interpretation of both intervals in the subsequent sections.


