Workbooks 6: 'Partial correlational data.xlsx' and 7: 'Semi-partial correlational data.xlsx'
The workbooks and a pdf-version of this user manual can be downloaded from here.
Both partial and semi-partial correlations are used to compare results of studies that have used different regression models (Aloë & Becker, 2012; Aloë, 2014). Although partial and semi-partial correlations have the same scale and statistical characteristics as zero-order correlation, it is recommended not to mix these three types of correlation because they are essentially different effect size measures. For a brief description these effect size measures see the section in which we guide you in selecting the appropriate workbook.
Fisher's transformation
In every worksheet of Workbook 6, the user can choose to apply Fisher’s transformation. Note that, as yet, the distributional behaviours of partial correlations and of Fisher’s transformed values are not well known (e.g., Aloë, 2014, p. 48). It is recommended to run both analyses and compare the results.
Input sheet
There are various input options Workbooks 6 and 7 (see Figure 59 and Figure 60). The user can either insert pre-calculated (semi-)partial correlations or can choose to let the Workbook calculate them. In the latter case, the three main input formats in Workbook 6 are:
- t-value, number of predictors, and number of observations (study dddd).
- Beta, standard error (of Beta), number of predictors, and number of observations (study gggg).
- Partial correlation, number of predictors, and number of observations (study jjjj).
- Partial correlation, standard error (of partial correlation), and number of observations (see study aaaa in Figure 31). Please note that Fisher’s transformation is not possible with this input (as indicated in the ‘Sufficient data’ column.
In Workbook 7, the possible input formats are similar to that of Workbook 6, however, providing the R-squared is mandatory for all input options except when providing the semi-partial correlation, the standard error (of the semi-partial correlation), and the number of observations.
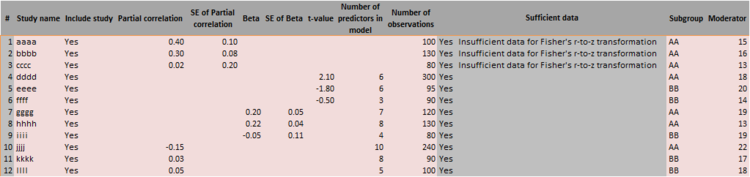
Figure 59: Input in Workbook 6 ‘Partial correlational data.xlsx’
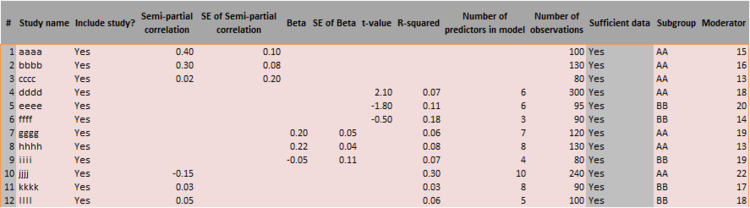
Figure 60: Input in Workbook 7 ‘Semi-partial correlational data.xlsx’
Forest Plot sheet
If the number of observations is not inserted on the input sheet, the confidence intervals of individual studies cannot not be generated because they rely on a Student’s t-distribution, for which an appropriate degrees of freedom needs to be specified. This applies to the Subgroup Analysis sheet as well.
References
Aloë, A. M. (2014). An empirical investigation of partial effect sizes in meta-analysis of correlational data. The Journal of General Psychology, 141(1), 47-64. dx.doi.org/10.1080/00221309.2013.853021
Aloë, A. M., & Becker, B. J. (2012). An effect size for regression predictors in meta-analysis. Journal of Educational and Behavioral Statistics, 37(2), 278-297. dx.doi.org/10.3102/1076998610396901