Moderator Analysis sheet
Refer to the Moderator Analysis page for details on how to interpret.
The workbooks and a pdf-version of this user manual can be downloaded from here.
If you entered a score in the ‘Moderator’ column of the Input sheet, then a weighted regression will be run with ‘Moderator’ as a predictor of the effect size of a study. In Meta-Essentials, it is not possible to run a multivariate regression analysis, so only one moderator can be assessed at a time. You can access the Moderator Analysis sheet by clicking on the regarding tab, as shown in Figure 14.

Figure 14: The tab to access the Moderator Analysis sheet of Meta-Essentials
On the left of the sheet (displayed in Figure 15), the user can choose between a ‘fixed effect’ model and a ’random effects’ model. The user can also set the confidence level. As in other sheets, the random effects model is set as default. Also a table is provided with some essential statistics per study.
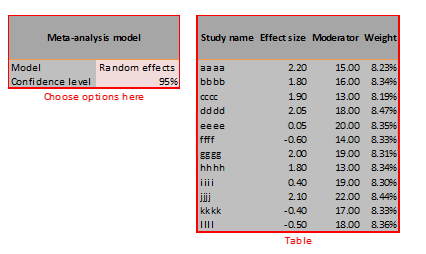
Figure 15: Example of part of the left part of the Moderator Analysis sheet
The most important result of this regression is the coefficient (B) of the slope (see red rectangle in Figure 16), which is an estimate of the association between the moderator and a study’s effect size. This is also visualized in the plot (also shown in Figure 16), where the effect sizes of the studies are plotted against their moderator values and a regression line through these points. Note that the size of the dots represents their relative weight. However, since in the example all studies receive about the same weight, the dot sizes appear to be equal.
The moderator analysis also provides an analysis of variance (ANOVA). The sums of squares depend on the choice between a fixed effect (Q) and random effects model (Q*). The sum of squares of the model (Q or Q*) can be used to test whether effect sizes vary with the moderator. I.e., to test whether the effect sizes are the same for different values of the moderator.
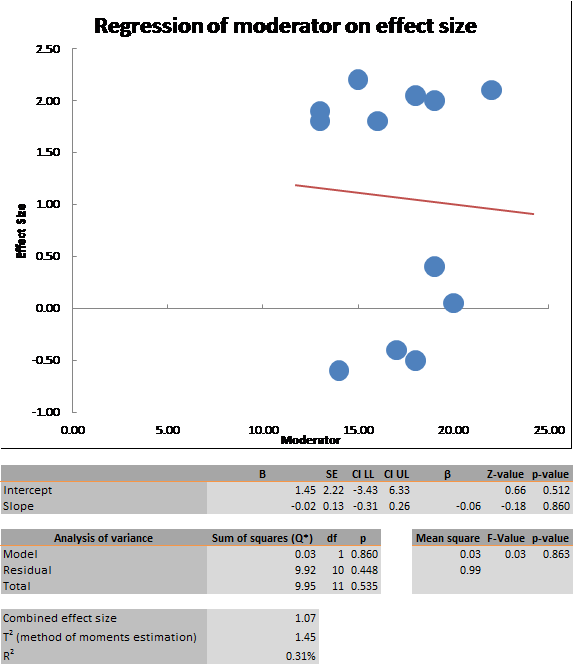
Figure 16: Example of right part of the Moderator Analysis sheet