Publication Bias Analysis sheet
Refer to the Publication Bias Analysis page for details on how to interpret.
The workbooks and a pdf-version of this user manual can be downloaded from here.
Publication bias analysis is not a core meta-analysis feature and for some of the methods rather strong assumptions apply, which means they should be used with caution (see Hak et al., 2015).
Multiple procedures or statistics regarding publication bias analysis are provided by Meta-Essentials: funnel plot, Egger regression, Begg and Mazumdar's rank correlation test, standardized residual histogram, Galbraith plot, normal quantile plot, and several failsafe-N tests. They can be accessed by clicking on the regarding tab, as shown in Figure 17.

Figure 17: The tab to access the Publication Bias Analysis sheet of Meta-Essentials
Because most of the publication bias analyses only make sense for a fixed effect model, we have set that as default for this sheet. You might, however, change it to random effects model in the table on the left of the sheet, where you can set the confidence level for confidence and prediction intervals as well (see red rectangle labelled ‘Choose options here’ in Figure 18).
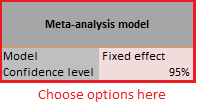
Figure 18: Example of left part of Publication Bias Analysis sheet
As in the Subgroup Analysis sheet, the user must click on the plus sign to open a particular procedure (see red rectangle in Figure 19).
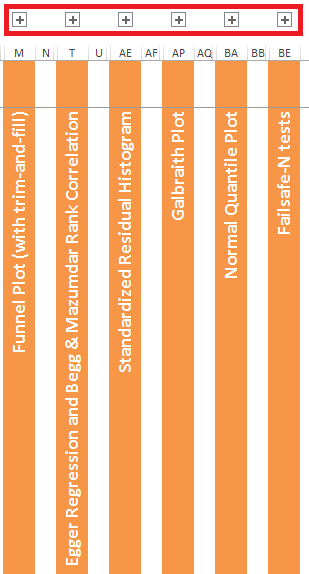
Figure 19: Example of right part of Publication Bias Analysis sheet
References
Hak, T., Van Rhee, H. J., & Suurmond, R. (2015). How to interpret results of meta-analysis. Rotterdam, The Netherlands: Erasmus Rotterdam Institute of Management. www.erim.eur.nl/research-support/meta-essentials/download