Workbooks 3: 'Differences between independent groups - continuous data.xlsx' and 4: 'Differences between dependent groups - continuous data.xlsx'
The workbooks and a pdf-version of this user manual can be downloaded from here.
Input sheet
Workbooks 3 and 4 have a rather large number of different input formats, see Figure 55 for Workbook 3 and Figure 56 for Workbook 4. Hence, an important feature of these workbooks is that it they function as effect size generators. For instance, the user can insert raw group data (means, standard deviations and sample sizes) or tests of differences (t-value, F-value) or already calculated effect sizes (Cohen’s d, Hedges’ g).
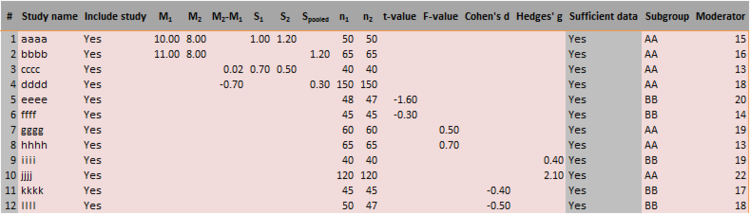
Figure 55: Input sheet of Workbook 3 ‘Differences between independent groups - continuous data.xlsx’
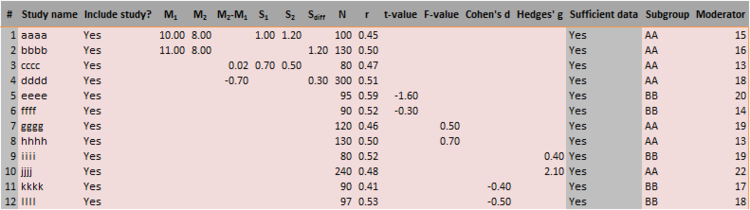
Figure 56: Input sheet of Workbook 4 ‘Differences between dependent groups - continuous data.xlsx’
Note the difference between the columns in the middle parts of these two figures which represents the difference in study design.
Sufficient data
Possible sufficient options are, amongst others (studies mentioned refer to Figure 55, Workbook 3):
- Means, standard deviations, and sample sizes for both groups:
- M1, M2, S1, S2, n1, and n2; as in study aaaa;
- Means for both groups, the pooled standard deviation, and sample sizes for both groups:
- M1, M2, Spooled, n1, n2; study bbbb;
- The difference in means, and the standard deviations and sample sizes of both groups:
- M2-M1, S1, S2, n1 and n2; study cccc;
- The difference in means, the pooled standard deviation, and sample sizes:
- M2-M1, Spooled, n1 and n2; study dddd;
- t-value and sample sizes:
- t-value, n1 and n2; study eeee;
- F-value and sample sizes:
- F-value, n1 and n2; study gggg;
- One of the effect sizes directly along with sample sizes:
- Cohen’s d OR Hedges’ g with n1 and n2; studies kkkk and iiii respectively.
Note that in each option the sample sizes of both groups are required input. As a comparison between Figure 55 and Figure 56 shows, exactly the same input options are available in Workbook 4, which is used when the effect size is a difference between two measurements in the same group, e.g., a ‘pre-test’ and a ‘post-test’. Sample size is also required in this workbook (of only one group by definition) as is the correlation coefficient (r) describing the association between pairs of observations in the regarding study. However, since this correlation is often not reported and cannot be derived from other provided statistics, “the researcher will need to use data from other sources to estimate this correlation. If the correlation is not known precisely, one could work with a range of plausible correlations and use a sensitivity analysis to see how these affect the results (Borenstein, 2009, pp. 227-228).
If more than sufficient information is entered, Meta-Essentials will automatically use the ‘simplest’ option: effect sizes first (where g is preferred over d), than means with standard errors, and finally t-values and F-values. Effect sizes will automatically be calculated as standardized mean differences. On the output sheets, the user can select either ‘Cohen’s d’ or ‘Hedges’ g’ as effect size measure.
Effect size measures
Cohen’s d and Hedges’ g are both standardized mean differences. Cohen’s d was first developed by Cohen (1969) and then Hedges (1981) found a bias, particularly present in case of small sample sizes. It is now customary to correct for this bias, but some still refer to it as Cohen’s d while Hedges’ g would be a clearer name for it. Others (such as Cumming, 2012) refer to the latter as dunbiased. In Meta-Essentials, Cohen’s d refers to the standardized mean difference as proposed by Cohen and Hedges’ g refers to the bias-adjusted standardized mean difference as proposed by Hedges.
References
Borenstein, M. (2009). Effect sizes for continuous data. In H. Cooper, L. V. Hedges & J. C. Valentine (Eds.), The handbook of research synthesis and meta-analysis (Second Ed.) (pp. 221-235). New York, NY: Russell Sage Foundation. www.worldcat.org/oclc/264670503
Cohen, J. (1969). Statistical power analysis for the behavioral sciences. New York, NY: Academic Press. www.worldcat.org/oclc/34549
Cumming, G. (2012). Understanding the new statistics: Effect sizes, confidence intervals, and meta-analysis. New York, NY: Routledge. dx.doi.org/10.4324/9780203807002
Hedges, L. V. (1981). Distribution theory for Glass's estimator of effect size and related estimators. Journal of Educational and Behavioral Statistics, 6(2), 107-128. dx.doi.org/10.2307/1164588