Workbook 5: 'Correlational data.xlsx'
The workbooks and a pdf-version of this user manual can be downloaded from here.
Fisher's transformation
The main difference between this workbook and the workbooks discussed so far is the use of a so-called Fisher’s r-to-z transformation (Fisher, 1921), which will automatically be applied because the transformed correlation (z) will tend to normality faster and the transformation is variance stabilizing. . For this transformed correlation, a standard error is estimated based on the number of subjects, the sample size.
Input sheet
Required input in this workbook is only (a) the correlation coefficient and (b) the sample size (see Figure 57). The meta-analysis is run with the Fisher-transformed values, which are transformed back into ‘normal’ correlation coefficients for presentation. The subscript z is used throughout this workbook to indicate transformed values. Please note that a correlation coefficient is equal to the standardized bivariate regression coefficient.
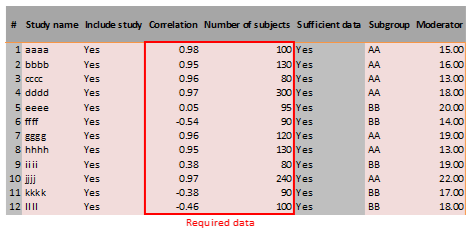
Figure 57: Input sheet of Workbook 5 ‘Correlational data.xlsx’
Forest Plot sheet
With the ‘Sort By’ function, the user can additionally choose from options that include Fisher-transformed values, such as for the effect size, correlation coefficient, and variance, see Figure 58 for an example; they are indicated with (z). Its values are then automatically displayed in column J (but not used in the plot or in the table for the combined effect size).
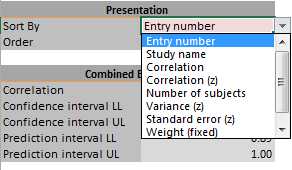
Figure 58: Example of ‘Sort By’ function on Input sheet of Workbook 5 ‘Correlational data.xlsx’
Moderator Analysis sheet
For the moderator analysis, Fisher’s transformed correlation coefficients are used and displayed. This is a difference with some other sheets, where after the necessary computations the Fisher’s transformed correlation coefficients are conversed back for presentation into ‘normal’ correlation coefficients.
Publication Bias Analysis sheet
For the publication bias analysis, Fisher’s transformed correlation coefficients are used and displayed. This is a difference with some other sheets, where after the necessary computations the Fisher’s transformed correlation coefficients are conversed back for presentation into ‘normal’ correlation coefficients.
References
Fisher, R. A. (1921). On the "probable error" of a coefficient of correlation deduced from a small sample. Metron, 1, 3-32. hdl.handle.net/2440/15169