Forest Plot sheet
Refer to the Forest Plot page for details on how to interpret.
The workbooks and a pdf-version of this user manual can be downloaded from here.
The Forest Plot sheet, which you can open by clicking on the regarding tab as shown in Figure 6, consists of three parts. On the left side, a number of statistics is presented that are generated by Meta-Essentials. Four important pieces of information are a) the (combined) effect size, b) the lower and upper limits of its confidence interval (CI), c) the lower and upper limits of its prediction interval (PI), and d) several heterogeneity statistics. In the middle, a table is given with the individual study results (see the red rectangle labelled ‘Table’ in Figure 7) and a graphical representation of the weights assigned to the studies in the meta-analysis. Finally, on the right side, the ‘forest plot’ pictures the effect size (with confidence interval) of each study and, below them, (a) the combined effect size with its confidence interval (in black colour) and its prediction interval (in green colour). These are the basic outcomes of any meta-analysis.

Figure 6: The tab to access the Forest Plot sheet of Meta-Essentials
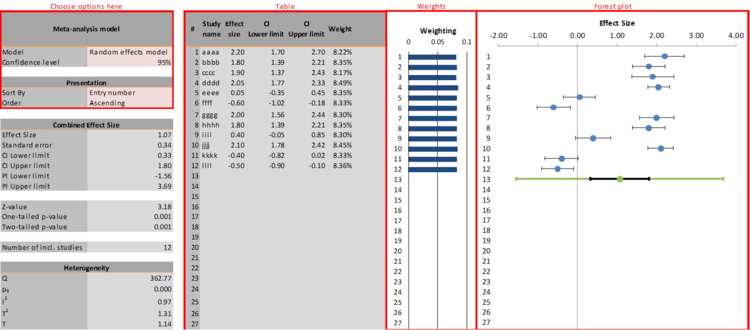
Figure 7: Example of the Forest Plot sheet
Choose options
In the top left corner of the sheet (see the red rectangle labelled ‘Choose options here’ in Figure 6) the user can make some choices regarding the meta-analysis itself (‘random effects’ versus ‘fixed effect’, and confidence level) and regarding the ordering of studies on the output sheets (sorting criterion and sorting order).
The user can choose between a ‘fixed effect’ model and a ‘random effects’ model. In the ‘fixed effect’ model it is assumed that all differences between effect sizes observed in different studies are due to sampling error only. In other words, the (unobserved) ‘true’ effect is assumed to be the same for each study and the studies are functionally equivalent. The aim of the meta-analysis is to estimate that true effect and the combined effect size (and its confidence interval) are interpreted as an estimate of the ‘true’ effect. In the ‘random effects’ model it is assumed that it is possible (or likely) that different ‘true’ effects underlie the effect sizes from different studies. The aim of the meta-analysis is to estimate (and then explain) the variance of these true effects and the prediction interval is interpreted as an estimate of that variance or dispersion (for a more detailed discussion of these models see, e.g., Hedges & Vevea, 1998). In Meta-Essentials the random effects model is used by default because the assumptions underlying the fixed effect model are very rarely met, especially in the social sciences. Furthermore, when a fixed effect model would make sense to use, i.e., when there is little variance in effect sizes, the random effects model converges automatically into a fixed effect model.
Prediction interval
The Meta-Essentials software does not only generate a confidence interval for the combined effect size but additionally a ‘prediction interval’. Most other software for meta-analysis will not generate a prediction interval, although it is - in our view - the most essential outcome in a ‘random effects’ model, i.e. when it must be assumed that ‘true’ effect sizes vary. If a confidence level of 95% is chosen, the prediction interval gives the range in which, in 95% of the cases, the outcome of a future study will fall, assuming that the effect sizes are normally distributed (of both the included, and not (yet) included studies). This in contrast to the confidence interval, which “is often interpreted as indicating a range within which we can be 95% certain that the true effect lies. This statement is a loose interpretation, but is useful as a rough guide. The strictly-correct interpretation [… is that, i]f a study were repeated infinitely often, and on each occasion a 95% confidence interval calculated, then 95% of these intervals would contain the true effect.” (Schünemann, Oxman, Vist, Higgins, Deeks, Glasziou, & Guyatt, 2011, Section 12.4.1). As this is a user manual for the software of Meta-Essentials and not an introduction to the aims and best practices of meta-analysis, we cannot expand here on the importance of the prediction interval vis-à-vis the confidence interval (but see, e.g., Hak, Van Rhee, & Suurmond, 2015; Higgins, Thompson, & Spiegelhalter, 2009).
References
Hak, T., Van Rhee, H. J., & Suurmond, R. (2015). How to interpret results of meta-analysis. Rotterdam, The Netherlands: Erasmus Rotterdam Institute of Management. http://www.erim.eur.nl/research-support/meta-essentials/download/
Hedges, L. V., & Vevea, J. L. (1998). Fixed-and random-effects models in meta-analysis. Psychological Methods, 3(4), 486. dx.doi.org/10.1037/1082-989x.3.4.486
Higgins, J., Thompson, S. G., & Spiegelhalter, D. J. (2009). A re‐evaluation of random‐effects meta‐analysis. Journal of the Royal Statistical Society. Series A, (Statistics in Society), 172(1), 159. dx.doi.org/10.1111/j.1467-985x.2008.00552.x
Schünemann, H. J., Oxman, A. D., Vist, G. E., Higgins, J. P. T., Deeks, J. J., Glasziou, P., & Guyatt, G. H. (2011). Confidence intervals. In J. P. T. Higgins, & S. Green (Eds.), Cochrane handbook for systematic reviews of interventions (version 5.1.0) (Section 12) The Cochrane Collaboration. handbook.cochrane.org/chapter_12/12_4_1_confidence_intervals.htm