Standardized Residual Histogram
The workbooks and a pdf-version of this user manual can be downloaded from here.
The Standardized Residual Histogram is based on the idea that the z-scores of individual studies, also known as standardized residuals, are expected to follow a normal distribution around the combined effect size (Sutton et al., 2000, p. 41). To assess whether there are outliers in the effect sizes, one could put the residuals in bins and plot them against a standard normal distribution. The standardized residuals are arranged in 9 bins and the proportion of residuals in that bin determines the height of the bar (see Figure 23 for an example).
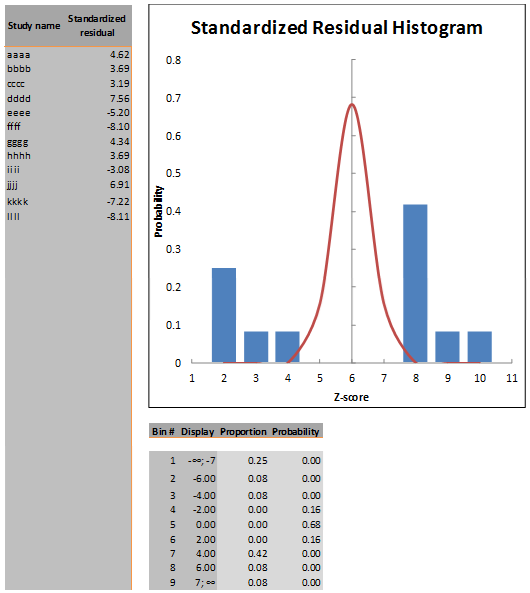
Figure 23: Example of Standardized Residual Histogram part
References
Sutton, A. J., Abrams, K. R., Jones, D. R., Jones, D. R., Sheldon, T. A., & Song, F. (2000). Methods for meta-analysis in medical research. Chichester, U.K.: Wiley. www.worldcat.org/oclc/44167986